
EDITORIAL
India detonated five nuclear devices, including a thermonuclear device, during May 11-13, 1998 at Pokhran in Rajasthan desert.
Preliminary studies of crater formations at the test site and analysis of seismic signals recorded at seismological observatories world-wide have shown that the total yield of the five detonations was around 60 kT. (BARC Newsletter, No. 172, May 1998).
Recently, radiochemical measurements were carried out at BARC on the samples extracted from the thermonuclear test site at Pokhran, and the result of these measurements also proved that the yield of the thermonuclear device was 50 ± 10kT, which is in close proximity to the estimated value of 45kT. In the feature article in this issue, S.B. Manohar et al. discuss some of the procedures adopted for the radiochemical analysis of the samples as well as the calculation of the yield.
Organophosphorus metal extractants find wide application in nuclear, base and precious metal industries. Di-2-ethyl-hexyl-phosphoric acid (D2EHPA) is a highly effective metal extractant, commercially used in the hydrometallurgy of cobalt, nickel, copper, zinc, rare earths and transuranic elements. BARC has developed a novel process for synthesising technical grade D2EHPA with a yield of ~ 98% at a relatively low cost. The process was successfully implemented at Heavy Water Plant, Talcher, for industrial scale production of D2EHPA.
People all over the
world are worried whether the Y2K problem posed by the computer systems
and their applications will jeopardize the smooth transition of economic,
social, scientific and industrial activities into the next millennium.
Umesh Chandra and A.K. Chandra discuss how the problem is being tackled
in BARC. A Y2K Task Force has been constituted by Dr Anil Kakodkar, Director,
BARC, to spread awareness, compile an inventory of all susceptible equipment,
systems and software, carry out a detailed assessment for Y2K vulnerability,
execute remediation wherever required and prepare contingency plans
POST SHOT RADIOACTIVITY MEASUREMENTS ON SAMPLES EXTRACTED FROM THERMONUCLEAR TEST SITE
The five nuclear tests
conducted during May 11-13, 1998 at Pokhran in Rajasthan desert included
a thermonuclear device, a standard fission device and three small nuclear
devices of subkiloton yields (1-3). In the present report, the results
of some of the radiochemical measurements carried out at BARC on samples
extracted from the thermonuclear test site are reported.
The type of radioactivity generated in a nuclear explosion depends upon the nature of the device. For example, in a pure fission device the energy is released from fission of the fissile material. A typical fission reaction is given below,
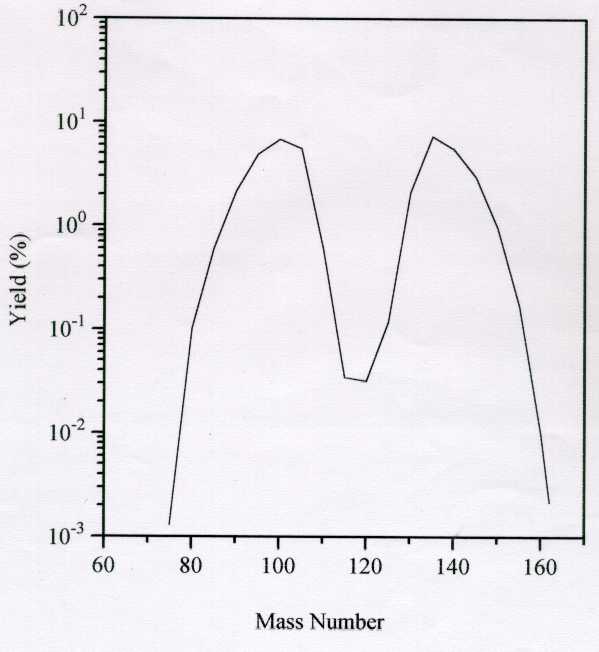
Several such fission events occur producing fission products with mass numbers ranging from 80 to 155. A typical mass yield distribution curve is given in Figure 1. The total energy released in a fission event is about 200MeV. One kiloton ( » 4.18x10¹⁹ ergs of primary energy release) of yield corresponds to 1.46x10²³ fission, that is, fission of about 57g of the fissile material. Thus, the yield of a fission device can be determined by measurement of the amount of the fission products in the debris. Over the years, the basic studies on mass and charge distribution in nuclear fission have resulted in very reliable data on fission yields (4).
 |
|
|
In a fusion reaction, the energy is released from fusion of hydrogen isotopes such as D and T, e.g.,
Usually the high temperature
(108 ° K) needed for such a reaction is achieved by a fission
trigger. The thermonuclear device tested at Pokhran used a fusion boosted
fission trigger. One kT of fusion yield corresponds to 1.5x1024
reactions which corresponds to fusion of 2.47 moles each of D and T. The
number of neutrons produced during fusion is same as the number of fusion
reactions and about 4 to 5 times more than that produced in fission reaction
to produce the same energy release. The high energy (~14 MeV) neutrons
produced in the above fusion reaction induce nuclear reactions of the type
(n,2n), (n,p) and (n,![]() ) in
the surrounding rock mass and construction materials and thus form the
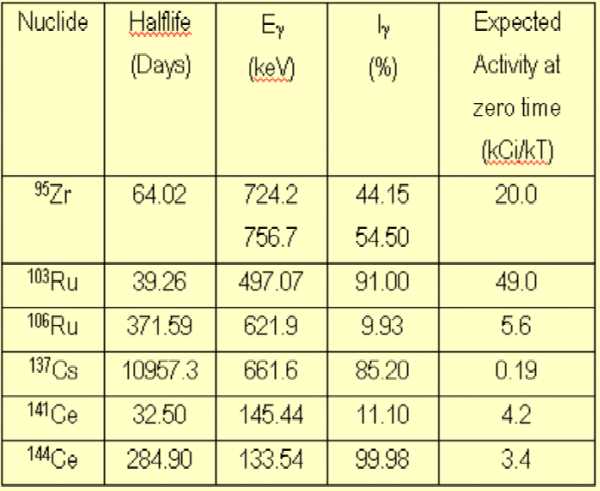
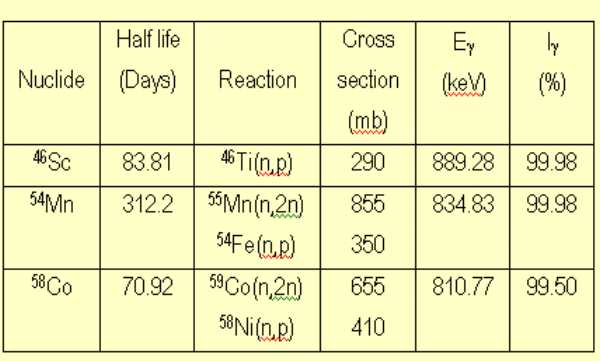
characteristic signature of such an event. Table 2 gives the relevant nuclear
data of 14 MeV neutron activation products measured in the present investigations.
) in
the surrounding rock mass and construction materials and thus form the
characteristic signature of such an event. Table 2 gives the relevant nuclear
data of 14 MeV neutron activation products measured in the present investigations.
Introduction
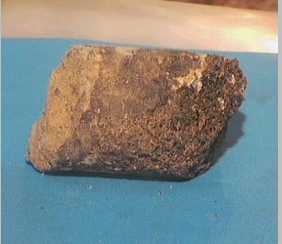
An underground explosion is carried out at a sufficient depth to avoid any radioactive contamination even at ground zero. The explosion creates a cavity above which a chimney is formed. The total energy of the reaction is released in less than a microsecond causing a tremendous rise in temperature as a result of which a large amount of material gets melted and evaporated. The gas expands in a few milliseconds and exerts great pressure on the surrounding walls. Thus, a cavity is produced in few tenths of a second. As the cavity expands, the internal pressure decreases and the molten material flows towards the bottom of the cavity forming a puddle (high activity zone). The fractured rock pieces having sizes varying from few microns to few centimeters fall into the molten puddle and start solidifying forming an inhomogeneous mass. The true molten portion of such a material has a glassy structure, mainly because of large amount of silica present in the rock, while even the adjacent portion may have a porous structure due to fine rubble particles which get embedded in this glassy material extracted from the test site. Figure 2 is a photograph of one such core sample. Radiochemical methods of determining the yield of the device involve
 |
|
|
measurement of radioactivity in the samples retrieved from this region. Several measurement strategies involving estimation of fission and fusion reactants, different fission and activation products and their daughter products are used to estimate the yield. It is also essential that a large number of samples be analysed to obtain the pattern of the distribution of these activities and, wherever necessary, evolve a method of integration to obtain the overall activity produced since any small sample taken in this puddle can hardly be expected to be a true representative of concentrations which can be related to the yield. What is reported here is one such methodology.
Methodology
The measurements consist of drilling and sampling, radiochemical measurements of radioactivity of fission and activation products and calculation of the yield.
Drilling and sampling
Drilling operations at the site of explosion were started within a few weeks of the event. These will be reported separately. Samples from drilling at the site of thermonuclear test were brought to BARC after initial measurements at the site. Samples from the near surface showed no radioactivity indicating complete containment of radioactivity from the explosion. Some of the samples at lower depths were very active giving gamma dose in the range of several mSv and hence had to be transported in well shielded boxes.
Radiochemical measurements of radioactivity
In order to take care of the expected inhomogeneity of the rock samples, about 100g of samples were ground to powder with a mesh size of less than 164 micron. In view of the large variation in the level of radioactivity, three different types of samples were prepared and assayed using high resolution gamma-ray spectrometry. These include (a) 25-30 g samples in a standard counting vial, (b) 100-200mg samples in the form of thin disc source, and (c) dissolution of a known amount of the powdered samples and assay of an aliquot (standard 5ml volume). In order to confirm the noninterference of gamma rays, radiochemical separations on a few selective samples were also carried out for measurement of activity of Zirconium, Cerium and Cobalt. The results obtained by all the four methods were found to agree within the experimental errors (5-7%).
For the gamma-ray
spectrometric measurements, a well shielded 100 CC HPGe detector coupled
to a PC based 4K MCA system was used. The resolution of the detector was
2.0 keV at the 1332 keV gamma-ray peak. Efficiency calibration of the system
was carried out using 152Eu activity and the multiple standards
were prepared in the required geometry. The efficiency (![]() ) was fitted to a polynomial of the form,
) was fitted to a polynomial of the form, ![]() The efficiency values were checked periodically. The counting times for
the samples varied from 20Ksec to 100Ksec so as to achieve good counting
statistics (better than 1%). The peak areas of the photopeaks were obtained
by the peak fitting program SAMPO as well as Fourier Transform based DSP
software developed in Radiochemistry Division (5). The absolute
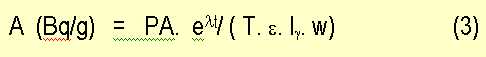
activity (A) of a radioisotope was expressed as Bq/g as on May 11, 1998
and was obtained using the formula,
The efficiency values were checked periodically. The counting times for
the samples varied from 20Ksec to 100Ksec so as to achieve good counting
statistics (better than 1%). The peak areas of the photopeaks were obtained
by the peak fitting program SAMPO as well as Fourier Transform based DSP
software developed in Radiochemistry Division (5). The absolute
activity (A) of a radioisotope was expressed as Bq/g as on May 11, 1998
and was obtained using the formula,
 |
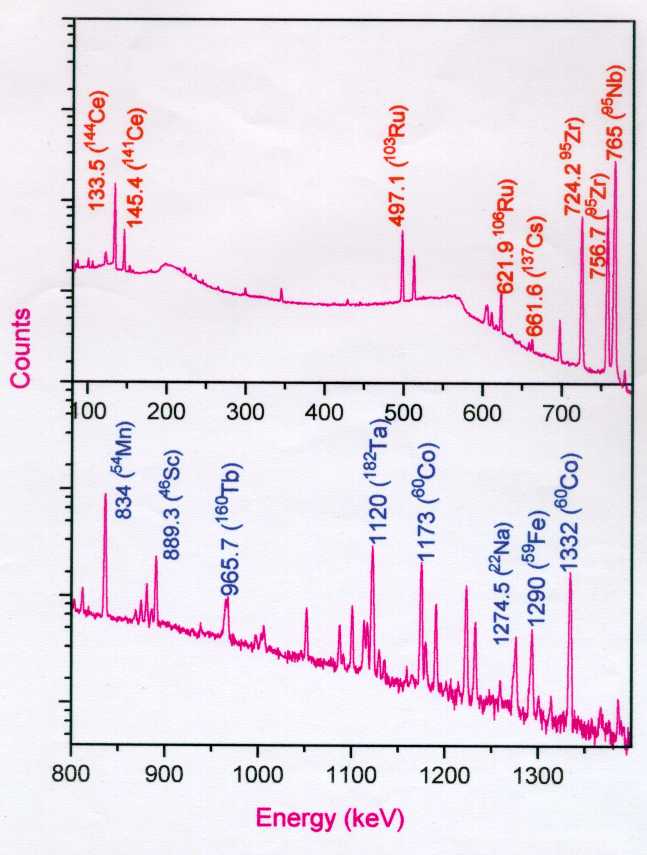 |
| Fig. 3. Gamma-ray spectrum of a typical sample of thermonuclear test |
Figure 3 gives the gamma-ray
spectrum of a typical sample indicating the gamma-ray peaks due to fission
and activation products. The measured radioactivities of fission products
were used to arrive at the number of fission per gram of the sample using
the appropriate fission yields. Though the activities were measured for
all the fission products listed in Table 1, the fission per gram was obtained
from the activity data of 95Zr and 144Ce. These are
high yield fission products, are refractory in nature and do not have gaseous
precursors which can escape (like 137Cs), or form volatile compounds
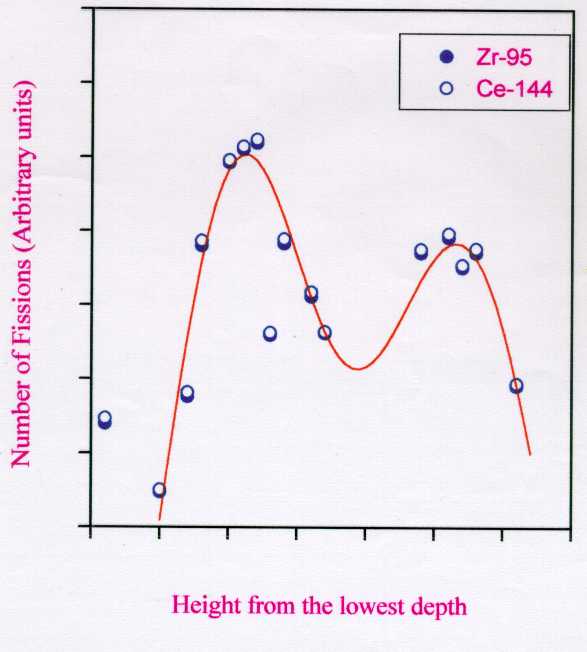
(like 103,106Ru). The number of fissions/gram (F) as a function
of the height for these two nuclides is plotted in Figure 4. Both the nuclides
give the identical distribution pattern indicating the overall reliability
of the measurements.
![]()
Calculation of
Yield
Figure 4 shows a large variation in number of fissions in the vertical direction.
 |
|
|
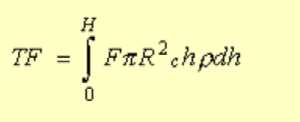
In order to obtain the
total number of fissions, it is necessary to devise a method of integration.
The radius of the crush zone was obtained from the drilling data and was
found to be about 60 m. This gave an estimate of the cavity radius (Rc)
as 40 ± 4 m. The early samples from the recent drilling operations
at a position 32 m away from the earlier position showed nearly same level
of radioactivity indicating that the Rc is positively more than 32m. The
total number of fissions (TF) was obtained by integrating the fitted curve
(Figure 4) over the entire active zone . This integration was carried out
using the following equation,
 |
(4) |
where r is the density of the material.
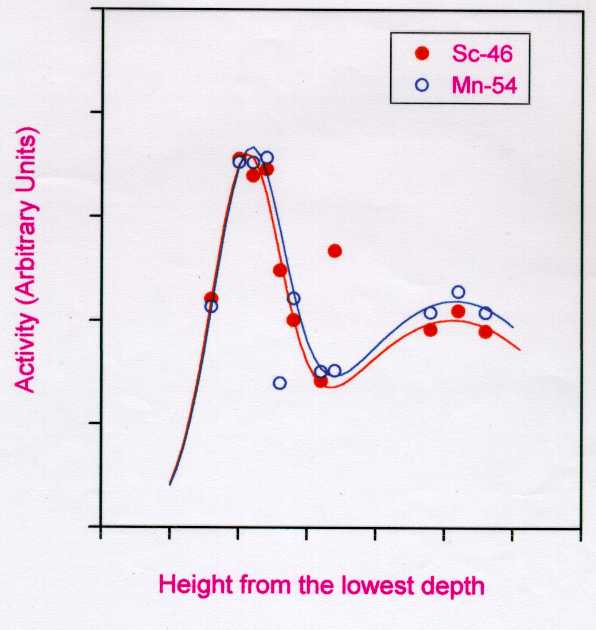
As stated earlier, the signatures of the fusion reaction are activation products due to 14 MeV neutrons, such as, 54Mn, 22Na, 58Co, 46Sc, as marked in the gamma-ray spectrum (Figure 3). The estimation of 14 MeV neutron yield from the measured radioactivity of these products requires the knowledge of the amount of the target elements present at the site of the event and the reaction cross sections. The two major radionuclides which could be assayed in most of the samples were 54Mn and 46Sc. Although the fission neutron spectrum has a high energy tail, the total number of neutrons produced by fusion fraction being much larger, the majority of the high energy neutrons can be attributed to fusion neutrons.
![]()
 |
|
|
Figure 5 shows the profile of the activity of these 14 MeV neutron activation products. The total activity of 46Sc and 54Mn was obtained by integration procedure as that for the fission products. In order to obtain an estimate of the yield of the fusion part of the thermonuclear device, the measured activities of these products were compared with the calculations based on the Monte Carlo simulations (6).
The two main factors determining
the amount and nature of radioactivity generated in the rock are: i) the
chemical composition of the rock, and ii) the number and energy of neutrons
escaping from the device. Monte Carlo simulation of the activity of radionuclides
formed by reactions, such as (n,p), (n,2n), (n,![]() ),
etc., were carried out, with certain assumptions (a) about the number of
neutrons escaping from the device, and (b) that the number of neutrons
absorbed in any element is proportional to the weighted cross section of
all constituent isotopes for both the thermal and fast neutrons. The integrated
yield following the methodology described above is estimated to be 50kT.
),
etc., were carried out, with certain assumptions (a) about the number of
neutrons escaping from the device, and (b) that the number of neutrons
absorbed in any element is proportional to the weighted cross section of
all constituent isotopes for both the thermal and fast neutrons. The integrated
yield following the methodology described above is estimated to be 50kT.
Error analysis
The possible sources of error in the measurement of fission yield are : assay of radioactivity (5-7%); nuclear data such as half life, gamma-ray branching intensity and fission yields (8%); and the error in integration which arises mainly due to the error in Rc (15%). In the assessment of fusion yield, the sources of errors are uncertainty in the elemental composition of the surrounding rock and its effect on the neutron spectrum used in the Monte Carlo simulations of the activity. The propagation of these errors leads to an overall error on the measured yield which is around 20%. Thus it is concluded that the total yield of the thermonuclear device is 50 + 10 kT.
Acknowledgement
Authors wish to express their gratitude to Dr R. Chidambaram for his keen interest and encouragement during this work. The authors acknowledge with thanks the contribution of Dr.S.K.Sikka and Mr. D.S.C.Purushotham in these assessments. The authors would also like to express their thanks to Dr A.V.R. Reddy, Dr A.Ramaswami, Dr A.Goswami, Dr A.G.C.Nair, Mr. S.P.Dange, Mr R.N. Acharya, and other colleagues from Radiochemistry and Fuel Chemistry Divisions who have contributed in these measurements.
References
1. S.K.Sikka
and Anil Kakodkar, BARC Newsletter, No. 172, May 1998.
2.
S.K.Sikka, Falguni Roy, G.J.Nair, V.G .Kolvankar and Anil Kakodkar, BARC
Newsletter, No. 178, Nov. 1998.
3.
S.K.Sikka, Falguni Roy and G.J.Nair, Current Science, 75,
486 (1998).
4.
B.F. Rider, "Compilation of Fission Product Yields", NEDO-12154-3 ©,
1981
5.
S.S.Rattan and V.K.Madan, BARC Report E-038 (1994).
6.
V.K.Sharma, Private Communication.
![]()